14. PCA: Examples and Observations#
Principle Component Analysis (PCA) is one of the more complex concepts in data science. In this notebook, we look at some examples and make some general observations as to the (beneficial) effects and uses of PCA.
14.1. The Smoothie Bar — A PCA Analogy#
Menu — Individual Ingredients with Measurements
# |
Name |
Ingredients & Amounts |
|---|---|---|
1 |
Purple Rain |
Acai 4oz, Banana 1, Peanut Butter 2 tbsp, Strawberry ½ cup, Blueberry ½ cup, Raspberry ½ cup |
2 |
Morning Warrior |
Greek Yogurt 6oz, Protein Powder 1 scoop, Almond Milk 8oz, Maca Powder 1 tsp, Espresso 1oz, Ginger ½ tsp |
3 |
Green Goddess |
Spinach 1 cup, Kale ½ cup, Cucumber 3oz, Orange Juice 4oz, Lime Juice 1 tbsp, Lemon 1 tbsp, Bee Pollen 1 tsp, Chia Seeds 1 tbsp, Spirulina 1 tsp |
4 |
Tropical Storm |
Coconut Milk 8oz, Pineapple ½ cup, Mango ½ cup, Peach ½ cup, Cherry ¼ cup, Apricot ¼ cup |
5 |
Berry Protein |
Greek Yogurt 6oz, Protein Powder 1 scoop, Almond Milk 8oz, Strawberry ½ cup, Blueberry ½ cup, Raspberry ½ cup |
6 |
Island Dream |
Coconut Milk 8oz, Pineapple ½ cup, Mango ½ cup, Orange Juice 4oz, Lime Juice 1 tbsp, Lemon 1 tbsp |
7 |
Acai Superfood |
Acai 4oz, Banana 1, Peanut Butter 2 tbsp, Bee Pollen 1 tsp, Chia Seeds 1 tbsp, Spirulina 1 tsp |
8 |
Choco Thunder |
Greek Yogurt 6oz, Protein Powder 1 scoop, Almond Milk 8oz, Cacao Powder 2 tbsp, Cacao Nibs 1 tbsp, Honey 1 tbsp, Almond Butter 2 tbsp, Rolled Oats ¼ cup |
9 |
Detox Green |
Spinach 1 cup, Kale ½ cup, Cucumber 3oz, Orange Juice 4oz, Lime Juice 1 tbsp, Lemon 1 tbsp, Maca Powder 1 tsp, Espresso 1oz, Ginger ½ tsp |
10 |
Sunrise |
Acai 4oz, Banana 1, Peanut Butter 2 tbsp, Peach ½ cup, Cherry ¼ cup, Apricot ¼ cup, Orange Juice 4oz, Lime Juice 1 tbsp, Lemon 1 tbsp |
11 |
Jungle Juice |
Coconut Milk 6oz, Pineapple ½ cup, Mango ½ cup, Spinach 1 cup, Kale ½ cup, Cucumber 3oz |
12 |
Power Shake |
Greek Yogurt 6oz, Protein Powder 2 scoops, Almond Milk 8oz, Cacao Powder 2 tbsp, Cacao Nibs 1 tbsp, Maca Powder 1 tsp, Espresso 1oz, Ginger ½ tsp |
13 |
Beachside |
Coconut Milk 8oz, Pineapple ½ cup, Mango ½ cup, Strawberry ½ cup, Blueberry ½ cup, Raspberry ½ cup |
14 |
Zen Garden |
Spinach 1 cup, Kale ½ cup, Cucumber 3oz, Honey 1 tbsp, Almond Butter 2 tbsp, Rolled Oats ¼ cup, Bee Pollen 1 tsp, Chia Seeds 1 tbsp, Spirulina 1 tsp |
15 |
Triple Berry |
Acai 4oz, Banana 1, Peanut Butter 2 tbsp, Strawberry ½ cup, Blueberry ½ cup, Raspberry ½ cup, Honey 1 tbsp, Almond Butter 2 tbsp, Rolled Oats ¼ cup |
16 |
Coco Loco |
Coconut Milk 8oz, Pineapple ½ cup, Mango ½ cup, Cacao Powder 2 tbsp, Cacao Nibs 1 tbsp, Honey 1 tbsp, Almond Butter 2 tbsp, Rolled Oats ¼ cup |
17 |
Citrus Protein |
Greek Yogurt 6oz, Protein Powder 1 scoop, Almond Milk 8oz, Orange Juice 4oz, Lime Juice 1 tbsp, Lemon 1 tbsp, Bee Pollen 1 tsp, Chia Seeds 1 tbsp, Spirulina 1 tsp |
18 |
Green Machine |
Spinach 1 cup, Kale ½ cup, Cucumber 3oz, Greek Yogurt 4oz, Protein Powder 1 scoop, Almond Milk 6oz, Bee Pollen 1 tsp, Chia Seeds 1 tbsp, Spirulina 1 tsp |
19 |
Peachy Keen |
Acai 4oz, Banana 1, Peanut Butter 2 tbsp, Peach ½ cup, Cherry ¼ cup, Apricot ¼ cup, Honey 1 tbsp, Almond Butter 2 tbsp, Rolled Oats ¼ cup |
20 |
The Works |
Acai 4oz, Banana 1, Peanut Butter 2 tbsp, Coconut Milk 4oz, Pineapple ¼ cup, Mango ¼ cup, Strawberry ½ cup, Blueberry ½ cup, Raspberry ½ cup, Bee Pollen 1 tsp, Chia Seeds 1 tbsp, Spirulina 1 tsp |
Principal Components with Measurements
PC Name |
Category |
Ingredients & Amounts |
|---|---|---|
Acai Base |
Base |
Acai 4oz, Banana 1, Peanut Butter 2 tbsp |
Protein Base |
Base |
Greek Yogurt 6oz, Protein Powder 1 scoop, Almond Milk 8oz |
Green Base |
Base |
Spinach 1 cup, Kale ½ cup, Cucumber 3oz |
Tropical Base |
Base |
Coconut Milk 8oz, Pineapple ½ cup, Mango ½ cup |
Berry Blend |
Flavor |
Strawberry ½ cup, Blueberry ½ cup, Raspberry ½ cup |
Citrus Zing |
Flavor |
Orange Juice 4oz, Lime Juice 1 tbsp, Lemon 1 tbsp |
Stone Fruit |
Flavor |
Peach ½ cup, Cherry ¼ cup, Apricot ¼ cup |
Dark Chocolate |
Flavor |
Cacao Powder 2 tbsp, Cacao Nibs 1 tbsp |
Superfood Boost |
Add-on |
Bee Pollen 1 tsp, Chia Seeds 1 tbsp, Spirulina 1 tsp |
Energy Boost |
Add-on |
Maca Powder 1 tsp, Espresso 1oz, Ginger ½ tsp |
Creamy Boost |
Add-on |
Honey 1 tbsp, Almond Butter 2 tbsp, Rolled Oats ¼ cup |
Menu Re-expressed as Principal Components
# |
Name |
Base(s) |
Flavor(s) |
Add-on(s) |
|---|---|---|---|---|
1 |
Purple Rain |
Acai Base (1×) |
Berry Blend (1×) |
— |
2 |
Morning Warrior |
Protein Base (1×) |
— |
Energy Boost (1×) |
3 |
Green Goddess |
Green Base (1×) |
Citrus Zing (1×) |
Superfood Boost (1×) |
4 |
Tropical Storm |
Tropical Base (1×) |
Stone Fruit (1×) |
— |
5 |
Berry Protein |
Protein Base (1×) |
Berry Blend (1×) |
— |
6 |
Island Dream |
Tropical Base (1×) |
Citrus Zing (1×) |
— |
7 |
Acai Superfood |
Acai Base (1×) |
— |
Superfood Boost (1×) |
8 |
Choco Thunder |
Protein Base (1×) |
Dark Chocolate (1×) |
Creamy Boost (1×) |
9 |
Detox Green |
Green Base (1×) |
Citrus Zing (1×) |
Energy Boost (1×) |
10 |
Sunrise |
Acai Base (1×) |
Stone Fruit (1×), Citrus Zing (1×) |
— |
11 |
Jungle Juice |
Tropical Base (0.75×), Green Base (1×) |
— |
— |
12 |
Power Shake |
Protein Base (1×) + extra scoop |
Dark Chocolate (1×) |
Energy Boost (1×) |
13 |
Beachside |
Tropical Base (1×) |
Berry Blend (1×) |
— |
14 |
Zen Garden |
Green Base (1×) |
— |
Superfood Boost (1×), Creamy Boost (1×) |
15 |
Triple Berry |
Acai Base (1×) |
Berry Blend (1×) |
Creamy Boost (1×) |
16 |
Coco Loco |
Tropical Base (1×) |
Dark Chocolate (1×) |
Creamy Boost (1×) |
17 |
Citrus Protein |
Protein Base (1×) |
Citrus Zing (1×) |
Superfood Boost (1×) |
18 |
Green Machine |
Green Base (1×), Protein Base (0.67×) |
— |
Superfood Boost (1×) |
19 |
Peachy Keen |
Acai Base (1×) |
Stone Fruit (1×) |
Creamy Boost (1×) |
20 |
The Works |
Acai Base (1×), Tropical Base (0.5×) |
Berry Blend (1×) |
Superfood Boost (1×) |
Working through the examples, observe:
Features that vary together appear in the same Principle Components. As a result, PCA solves the co-linearity problem.
You can approximately reconstruct the original feature values with fewer than all the PCs.
import numpy as np
import pandas as pd

import matplotlib.pyplot as plt

from sklearn.decomposition import PCA
from sklearn.preprocessing import StandardScaler
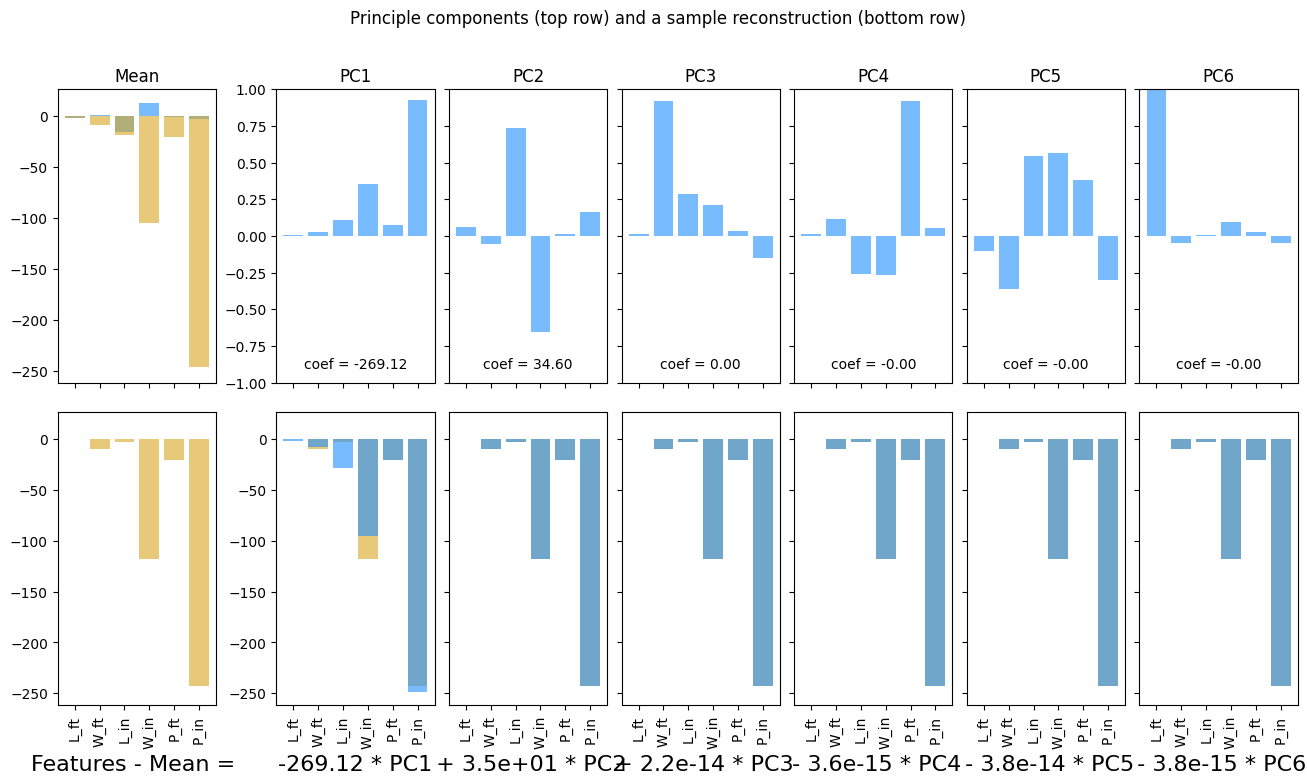
14.1.1. Example 0: Synthetic data (boxes)#
num_data = 100

boxes_dict = {'L_ft': 5*np.random.randn(num_data),
              'W_ft': 10*np.random.randn(num_data)
              }

boxes_df = pd.DataFrame(boxes_dict)
boxes_df
| L_ft | W_ft | |
|---|---|---|
| 0 | -1.507725 | -8.747656 |
| 1 | -2.087854 | -6.173149 |
| 2 | 1.611289 | 1.033444 |
| 3 | -4.126524 | -0.973193 |
| 4 | 2.107764 | -12.159853 |
| ... | ... | ... |
| 95 | -5.899326 | 1.027081 |
| 96 | -6.501513 | 1.506319 |
| 97 | 1.828042 | 1.278987 |
| 98 | 2.147934 | -2.109605 |
| 99 | -9.168768 | 6.091723 |
100 rows × 2 columns
boxes_df[['L_in', 'W_in']] = boxes_df[['L_ft','W_ft']]*12
boxes_df['P_ft'] = 2*(boxes_df['L_ft']+boxes_df['W_ft'])
boxes_df['P_in'] = 2*(boxes_df['L_in']+boxes_df['W_in'])

boxes_df
| L_ft | W_ft | L_in | W_in | P_ft | P_in | |
|---|---|---|---|---|---|---|
| 0 | -1.507725 | -8.747656 | -18.092697 | -104.971877 | -20.510762 | -246.129148 |
| 1 | -2.087854 | -6.173149 | -25.054250 | -74.077787 | -16.522006 | -198.264074 |
| 2 | 1.611289 | 1.033444 | 19.335466 | 12.401324 | 5.289465 | 63.473579 |
| 3 | -4.126524 | -0.973193 | -49.518293 | -11.678312 | -10.199434 | -122.393210 |
| 4 | 2.107764 | -12.159853 | 25.293172 | -145.918232 | -20.104177 | -241.250120 |
| ... | ... | ... | ... | ... | ... | ... |
| 95 | -5.899326 | 1.027081 | -70.791912 | 12.324976 | -9.744489 | -116.933873 |
| 96 | -6.501513 | 1.506319 | -78.018161 | 18.075824 | -9.990390 | -119.884675 |
| 97 | 1.828042 | 1.278987 | 21.936501 | 15.347843 | 6.214057 | 74.568688 |
| 98 | 2.147934 | -2.109605 | 25.775213 | -25.315255 | 0.076660 | 0.919916 |
| 99 | -9.168768 | 6.091723 | -110.025214 | 73.100678 | -6.154089 | -73.849072 |
100 rows × 6 columns
pca, fig, ax = plotPCA(boxes_df)
plt.show()
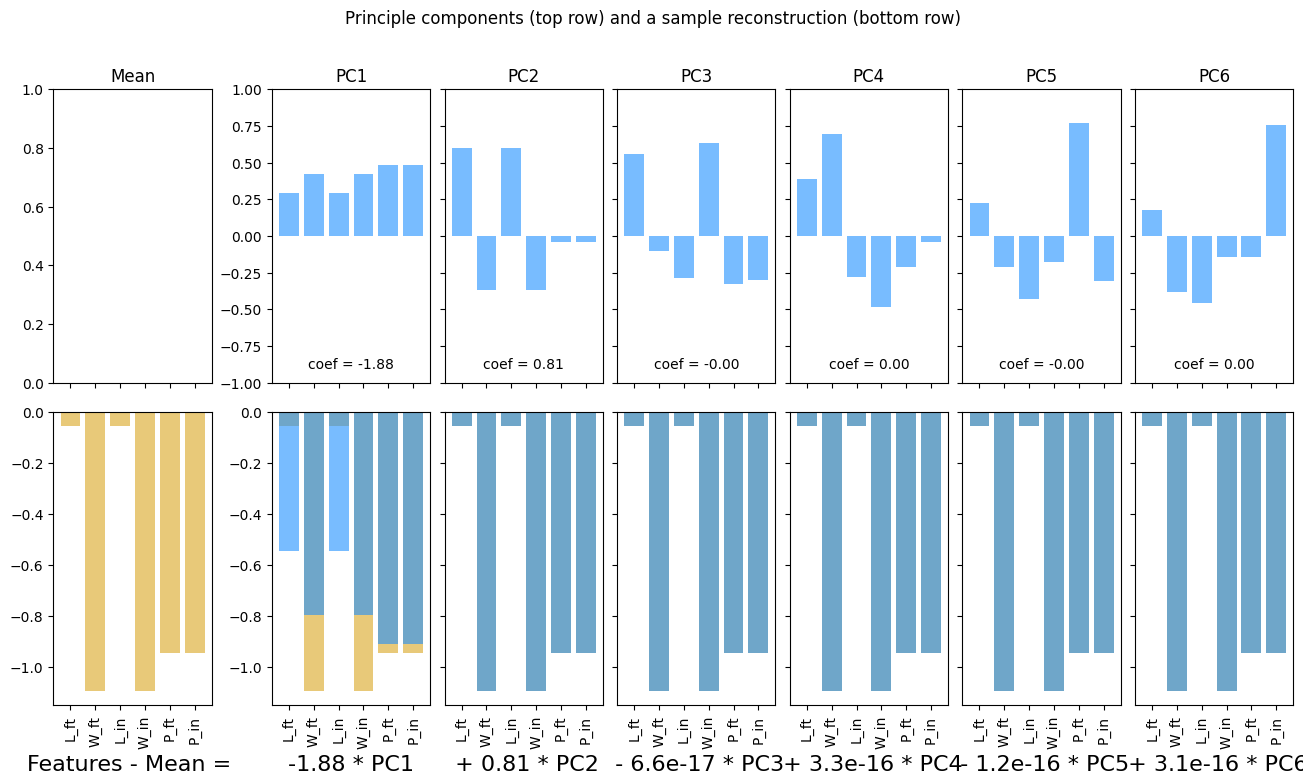
ss = StandardScaler()
boxes_scaled = ss.fit_transform(boxes_df)
boxes_scaled_df = pd.DataFrame(boxes_scaled, columns = boxes_df.columns)

pca_scaled, fig, ax = plotPCA(boxes_scaled_df)
plt.show()
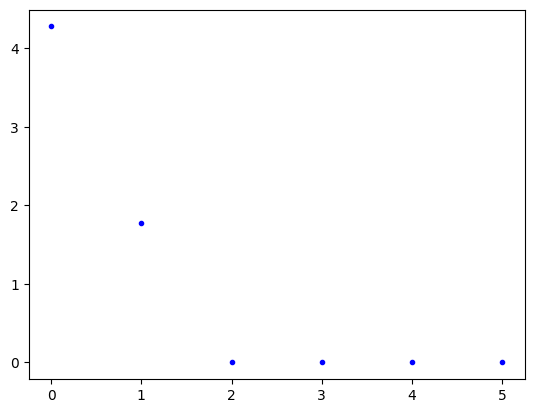
plt.plot(pca_scaled.explained_variance_, 'b.')
plt.show()
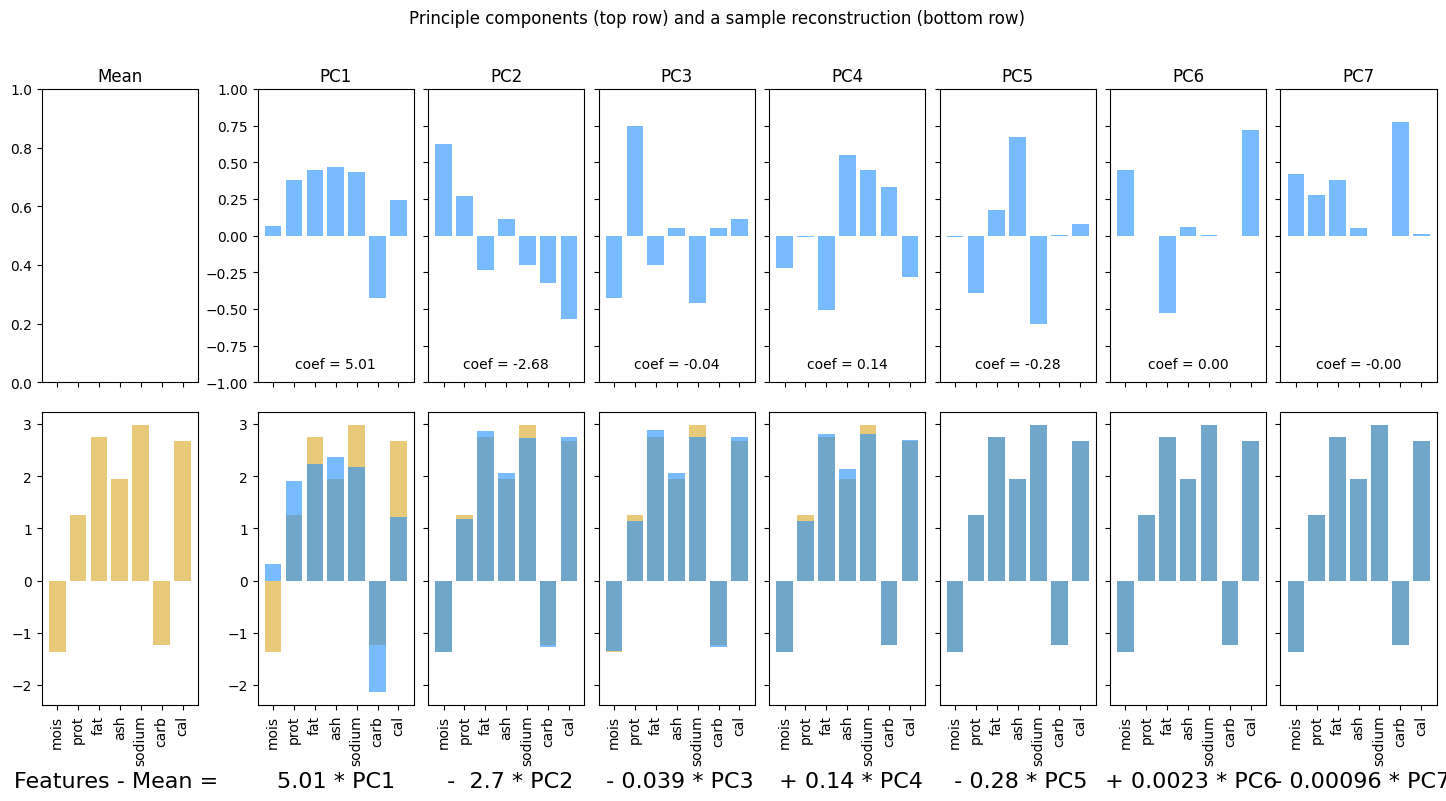
14.1.2. Example 1: Macro-nutrients#
macros_df = pd.read_csv('https://raw.githubusercontent.com/f-imp/Principal-Component-Analysis-PCA-over-3-datasets/refs/heads/master/datasets/Pizza.csv')
macros_df.head()
| brand | id | mois | prot | fat | ash | sodium | carb | cal | |
|---|---|---|---|---|---|---|---|---|---|
| 0 | A | 14069 | 27.82 | 21.43 | 44.87 | 5.11 | 1.77 | 0.77 | 4.93 |
| 1 | A | 14053 | 28.49 | 21.26 | 43.89 | 5.34 | 1.79 | 1.02 | 4.84 |
| 2 | A | 14025 | 28.35 | 19.99 | 45.78 | 5.08 | 1.63 | 0.80 | 4.95 |
| 3 | A | 14016 | 30.55 | 20.15 | 43.13 | 4.79 | 1.61 | 1.38 | 4.74 |
| 4 | A | 14005 | 30.49 | 21.28 | 41.65 | 4.82 | 1.64 | 1.76 | 4.67 |
features_to_keep = ['mois', 'prot', 'fat', 'ash', 'sodium', 'carb', 'cal']

macros_df = macros_df[features_to_keep]
macros_df
| mois | prot | fat | ash | sodium | carb | cal | |
|---|---|---|---|---|---|---|---|
| 0 | 27.82 | 21.43 | 44.87 | 5.11 | 1.77 | 0.77 | 4.93 |
| 1 | 28.49 | 21.26 | 43.89 | 5.34 | 1.79 | 1.02 | 4.84 |
| 2 | 28.35 | 19.99 | 45.78 | 5.08 | 1.63 | 0.80 | 4.95 |
| 3 | 30.55 | 20.15 | 43.13 | 4.79 | 1.61 | 1.38 | 4.74 |
| 4 | 30.49 | 21.28 | 41.65 | 4.82 | 1.64 | 1.76 | 4.67 |
| ... | ... | ... | ... | ... | ... | ... | ... |
| 295 | 44.91 | 11.07 | 17.00 | 2.49 | 0.66 | 25.36 | 2.91 |
| 296 | 43.15 | 11.79 | 18.46 | 2.43 | 0.67 | 24.17 | 3.10 |
| 297 | 44.55 | 11.01 | 16.03 | 2.43 | 0.64 | 25.98 | 2.92 |
| 298 | 47.60 | 10.43 | 15.18 | 2.32 | 0.56 | 24.47 | 2.76 |
| 299 | 46.84 | 9.91 | 15.50 | 2.27 | 0.57 | 25.48 | 2.81 |
300 rows × 7 columns
pca = PCA(n_components = 6)
macros_pca = pca.fit_transform(macros_df)

pca_df = pd.DataFrame(data = pca.components_, columns = macros_df.columns)
pca_df
| mois | prot | fat | ash | sodium | carb | cal | |
|---|---|---|---|---|---|---|---|
| 0 | -0.276963 | -0.266941 | -0.278934 | -0.055434 | -0.011142 | 0.878084 | -0.000603 |
| 1 | 0.747074 | -0.055733 | -0.657845 | -0.040604 | -0.023814 | 0.006818 | -0.061254 |
| 2 | -0.352016 | 0.809718 | -0.467976 | 0.022225 | -0.026245 | -0.012469 | -0.010062 |
| 3 | -0.195900 | -0.255747 | -0.259802 | 0.871443 | 0.201453 | -0.164525 | -0.040678 |
| 4 | 0.059475 | 0.083719 | 0.035776 | -0.166634 | 0.978316 | 0.057470 | 0.001497 |
| 5 | 0.440974 | 0.443490 | 0.448624 | 0.450220 | -0.030463 | 0.444405 | -0.080452 |
feature_names = list(macros_df.columns)
ss = StandardScaler()

X = ss.fit_transform(macros_df)
fig, ax = plotPCA(X, feature_names = feature_names)
---------------------------------------------------------------------------
ValueError                                Traceback (most recent call last)
Cell In[11], line 5
      2 ss = StandardScaler()
      4 X = ss.fit_transform(macros_df)
----> 5 fig, ax = plotPCA(X, feature_names = feature_names)

ValueError: too many values to unpack (expected 2)
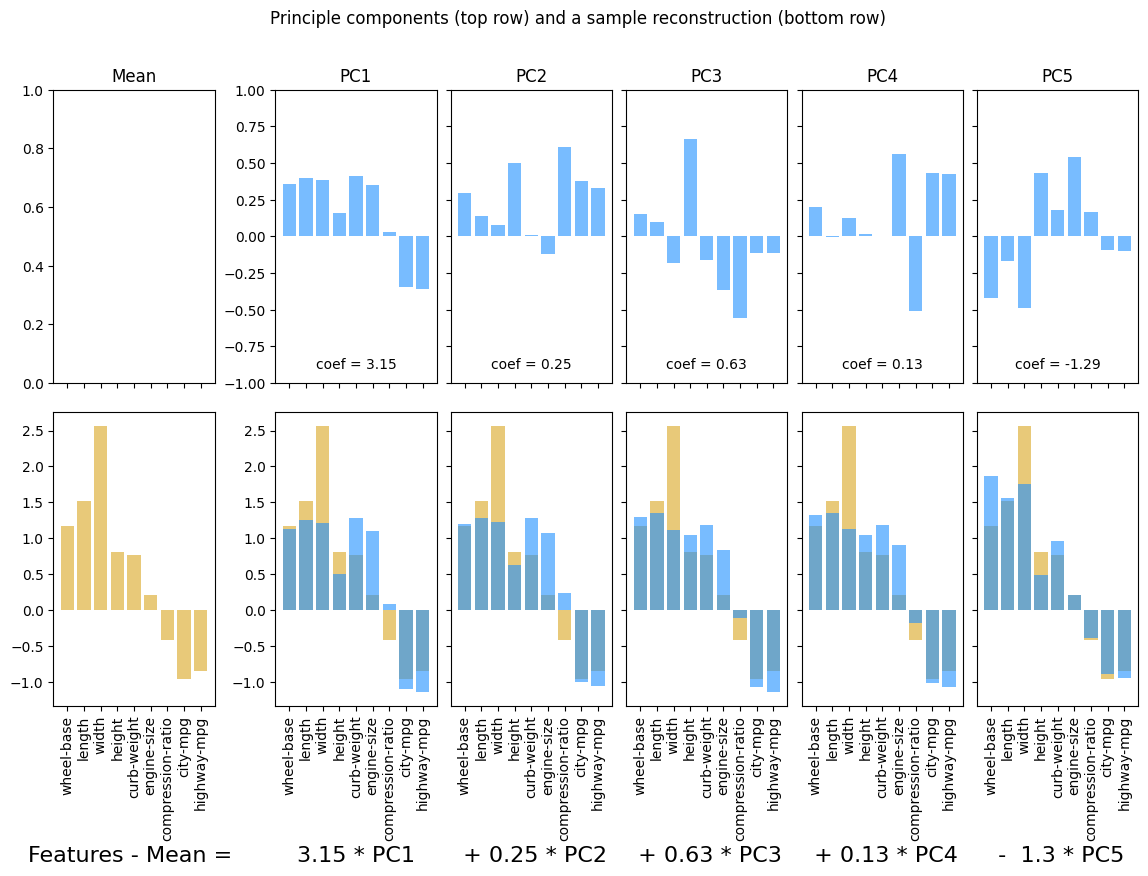
14.1.3. Example 2: Automobile specs#
cars_df = pd.read_csv('https://raw.githubusercontent.com/shreyamdg/automobile-data-set-analysis/refs/heads/master/cars.csv')
cars_df.head()
| Unnamed: 0 | symboling | normalized-losses | make | fuel-type | aspiration | num-of-doors | body-style | drive-wheels | engine-location | ... | engine-size | fuel-system | bore | stroke | compression-ratio | horsepower | peak-rpm | city-mpg | highway-mpg | price | |
|---|---|---|---|---|---|---|---|---|---|---|---|---|---|---|---|---|---|---|---|---|---|
| 0 | 0 | 3 | ? | alfa-romero | gas | std | two | convertible | rwd | front | ... | 130 | mpfi | 3.47 | 2.68 | 9.0 | 111 | 5000 | 21 | 27 | 13495 |
| 1 | 1 | 3 | ? | alfa-romero | gas | std | two | convertible | rwd | front | ... | 130 | mpfi | 3.47 | 2.68 | 9.0 | 111 | 5000 | 21 | 27 | 16500 |
| 2 | 2 | 1 | ? | alfa-romero | gas | std | two | hatchback | rwd | front | ... | 152 | mpfi | 2.68 | 3.47 | 9.0 | 154 | 5000 | 19 | 26 | 16500 |
| 3 | 3 | 2 | 164 | audi | gas | std | four | sedan | fwd | front | ... | 109 | mpfi | 3.19 | 3.40 | 10.0 | 102 | 5500 | 24 | 30 | 13950 |
| 4 | 4 | 2 | 164 | audi | gas | std | four | sedan | 4wd | front | ... | 136 | mpfi | 3.19 | 3.40 | 8.0 | 115 | 5500 | 18 | 22 | 17450 |
5 rows × 27 columns
specs_df = cars_df.select_dtypes(include = 'number').drop(columns = ['Unnamed: 0', 'symboling'])
names_df = cars_df[['make',  'num-of-doors', 'body-style', 'fuel-type']]
idx = 7

ss = StandardScaler()
X = ss.fit_transform(specs_df)
feature_names = list(specs_df.columns)

display(names_df.iloc[[7]])

plotPCA(X, num_components = 5, feature_names = feature_names, idx = idx)
plt.show()
| make | num-of-doors | body-style | fuel-type | |
|---|---|---|---|---|
| 7 | audi | four | wagon | gas |