
16. K-Means Clustering: An Animated Walkthrough#
This notebook animates the k-means algorithm step by step on the Iris dataset (petal length vs. petal width), so you can watch each phase of the algorithm unfold:
Initialize — place K centroids randomly in feature space
Assign — color each point by its nearest centroid
Update — move each centroid to the mean of its assigned points
Repeat until convergence
Voronoi decision boundaries are drawn so you can see why each point is assigned to its cluster.
import numpy as np
import matplotlib.pyplot as plt
import matplotlib.patches as mpatches
from matplotlib.animation import FuncAnimation
from matplotlib.colors import ListedColormap
from IPython.display import HTML

from sklearn.datasets import load_iris
from sklearn.metrics import silhouette_score

# ── Reproducibility ──────────────────────────────────────────────────────────
RNG = np.random.default_rng(7)
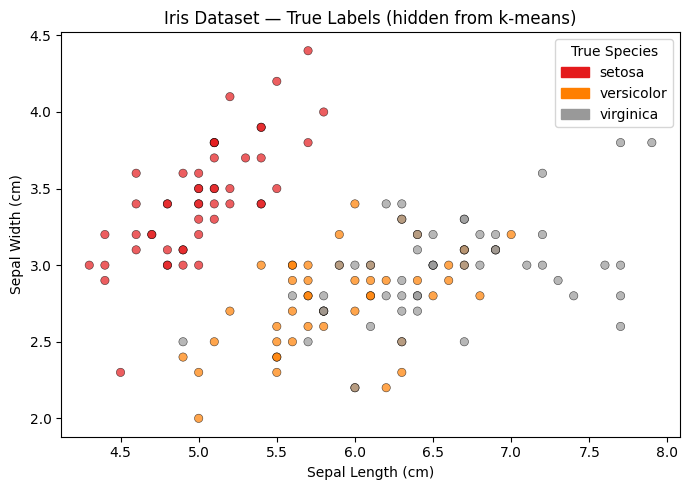
16.1. The Dataset: Iris Sepal Length vs. Sepal Width#
We use two features from the Iris dataset — sepal length (cm) and sepal width (cm). These features produce overlapping clusters, so the Voronoi boundaries and their meeting point (the triple-point) fall well within the data range — making the decision regions easy to see.
Note that we are hiding the true labels from the algorithm; k-means only sees the raw coordinates.
iris = load_iris()
# Features: sepal length (col 0) and sepal width (col 1)
X = iris.data[:, 0:2]
true_labels = iris.target
species = iris.target_names

fig, ax = plt.subplots(figsize=(7, 5))
scatter = ax.scatter(X[:, 0], X[:, 1], c=true_labels, cmap='Set1', alpha=0.7, edgecolors='k', linewidths=0.4)
ax.set_xlabel("Sepal Length (cm)")
ax.set_ylabel("Sepal Width (cm)")
ax.set_title("Iris Dataset — True Labels (hidden from k-means)")
handles = [mpatches.Patch(color=scatter.cmap(scatter.norm(i)), label=s) for i, s in enumerate(species)]
ax.legend(handles=handles, title="True Species")
plt.tight_layout()
plt.show()
16.2. K-Means From Scratch#
We implement k-means manually so we can record every intermediate state (every assign step and every update step), not just the final result.
def run_kmeans(X, K, rng, max_iter=15):
    """
    Run k-means and record every intermediate state.

    Returns a list of frames. Each frame is a dict:
        phase      : 'init' | 'assign' | 'update' | 'converged'
        iteration  : int
        centroids  : (K, 2) array — centroid positions THIS frame
        labels     : (N,)   array — cluster assignment of each point
        description: human-readable caption
    """
    n, d = X.shape

    # ── Initialization: pick K random points as starting centroids ────────────
    idx = rng.choice(n, size=K, replace=False)
    centroids = X[idx].copy()
    labels = np.full(n, -1, dtype=int)  # -1 = unassigned

    frames = []
    frames.append(dict(
        phase="init", iteration=0,
        centroids=centroids.copy(), labels=labels.copy(),
        description="Step 0 — Initialize: place K centroids at random data points"
    ))

    for it in range(1, max_iter + 1):
        # ── Assignment step ───────────────────────────────────────────────────
        # For each point, compute distance to every centroid; assign closest.
        dists = np.linalg.norm(X[:, None, :] - centroids[None, :, :], axis=2)  # (N, K)
        new_labels = np.argmin(dists, axis=1)

        frames.append(dict(
            phase="assign", iteration=it,
            centroids=centroids.copy(), labels=new_labels.copy(),
            description=f"Iteration {it} — Assign: color each point by its nearest centroid"
        ))

        # ── Update step ───────────────────────────────────────────────────────
        new_centroids = np.array([X[new_labels == k].mean(axis=0) for k in range(K)])

        frames.append(dict(
            phase="update", iteration=it,
            centroids=new_centroids.copy(), labels=new_labels.copy(),
            description=f"Iteration {it} — Update: move each centroid to its cluster mean"
        ))

        # ── Convergence check ─────────────────────────────────────────────────
        if np.allclose(centroids, new_centroids):
            frames.append(dict(
                phase="converged", iteration=it,
                centroids=new_centroids.copy(), labels=new_labels.copy(),
                description=f"Converged after {it} iteration(s) — no point changed cluster"
            ))
            break

        centroids = new_centroids
        labels = new_labels

    return frames


K = 3
frames = run_kmeans(X, K=K, rng=RNG)
print(f"Recorded {len(frames)} animation frames over {frames[-1]['iteration']} iteration(s).")
print("Phases:", [f['phase'] for f in frames])
Recorded 31 animation frames over 15 iteration(s).
Phases: ['init', 'assign', 'update', 'assign', 'update', 'assign', 'update', 'assign', 'update', 'assign', 'update', 'assign', 'update', 'assign', 'update', 'assign', 'update', 'assign', 'update', 'assign', 'update', 'assign', 'update', 'assign', 'update', 'assign', 'update', 'assign', 'update', 'assign', 'update']
16.3. The Animation#
Each frame shows:
Colored points — cluster assignment (gray = unassigned, during init)
Voronoi regions — background shading showing which centroid “owns” each area of feature space
Centroid markers — diamonds (◆) that move during the Update step
Caption — describes what just happened
Silhouette score panel (right) — plots the silhouette score after each assign step, revealing how cluster quality evolves. Dashed reference lines mark 0.50 (good) and 0.75 (strong) confidence thresholds. The current score is highlighted in red.
def make_animation(X, frames, K, interval_ms=900):
    """
    Build and return a FuncAnimation that steps through each k-means frame.
    Right panel tracks silhouette score (one point per assign step).
    """
    # ── Color palette ─────────────────────────────────────────────────────────
    CLUSTER_COLORS = ['#E63946', '#2A9D8F', '#F4A261']
    UNASSIGNED_COLOR = '#BBBBBB'

    # ── Voronoi grid ──────────────────────────────────────────────────────────
    pad = 0.3
    x_min, x_max = X[:, 0].min() - pad, X[:, 0].max() + pad
    y_min, y_max = X[:, 1].min() - pad, X[:, 1].max() + pad
    grid_res = 300

    gx = np.linspace(x_min, x_max, grid_res)
    gy = np.linspace(y_min, y_max, grid_res)
    grid_pts = np.c_[*np.meshgrid(gx, gy)]          # (grid_res², 2)

    bg_colors = [plt.cm.colors.to_rgba(c, alpha=0.18) for c in CLUSTER_COLORS]
    bg_cmap = ListedColormap(bg_colors)

    # ── Precompute silhouette score at each assign step ───────────────────────
    # One value per iteration (assign and update share the same labels, so
    # computing once per assign frame is sufficient).
    history = []   # list of (frame_idx, iteration, score)
    for fi, frame in enumerate(frames):
        if frame['phase'] == 'assign':
            score = silhouette_score(X, frame['labels'])
            history.append((fi, frame['iteration'], score))

    max_iter = frames[-1]['iteration']
    all_scores = [s for _, _, s in history]
    sil_lo = max(0.0, min(all_scores) - 0.05)
    sil_hi = min(1.0, max(all_scores) + 0.05)

    # ── Figure: main Voronoi plot + silhouette score panel ────────────────────
    fig, (ax, ax_sil) = plt.subplots(
        1, 2, figsize=(11, 5),
        gridspec_kw={'width_ratios': [3, 1]}
    )
    fig.patch.set_facecolor('white')

    # ── Main axes ─────────────────────────────────────────────────────────────
    ax.set_xlim(x_min, x_max)
    ax.set_ylim(y_min, y_max)
    ax.set_xlabel("Sepal Length (cm)", fontsize=11)
    ax.set_ylabel("Sepal Width (cm)", fontsize=11)

    bg_img = ax.imshow(
        np.zeros((grid_res, grid_res), dtype=int),
        extent=[x_min, x_max, y_min, y_max],
        origin='lower', aspect='auto',
        cmap=bg_cmap, vmin=0, vmax=K - 1,
        interpolation='nearest', zorder=0
    )

    scatter = ax.scatter(
        X[:, 0], X[:, 1],
        c=[UNASSIGNED_COLOR] * len(X),
        edgecolors='k', linewidths=0.4, s=45, zorder=2
    )

    centroid_scatters = []
    for k in range(K):
        cs = ax.plot([], [], marker='D', markersize=10,
                     color=CLUSTER_COLORS[k], markeredgecolor='black',
                     markeredgewidth=1.0, linestyle='none', zorder=4)[0]
        centroid_scatters.append(cs)

    caption = ax.text(
        0.5, 1.03, '', transform=ax.transAxes,
        ha='center', va='bottom', fontsize=10,
        bbox=dict(boxstyle='round,pad=0.3', facecolor='#F0F0F0', edgecolor='gray')
    )

    legend_handles = [
        mpatches.Patch(color=CLUSTER_COLORS[k], label=f'Cluster {k + 1}')
        for k in range(K)
    ]
    ax.legend(handles=legend_handles, loc='upper left', fontsize=9)

    # ── Silhouette panel ──────────────────────────────────────────────────────
    ax_sil.set_xlim(0.5, max_iter + 0.5)
    ax_sil.set_ylim(sil_lo, sil_hi)
    ax_sil.set_xlabel("Iteration", fontsize=10)
    ax_sil.set_ylabel("Silhouette Score", fontsize=10)
    ax_sil.set_title("Silhouette Score", fontsize=11)
    ax_sil.set_xticks(range(1, max_iter + 1))
    ax_sil.tick_params(axis='both', labelsize=9)
    # Reference lines for score quality thresholds
    ax_sil.axhline(0.50, color='#999999', linestyle='--', linewidth=0.8, label='0.50')
    ax_sil.axhline(0.75, color='#555555', linestyle='--', linewidth=0.8, label='0.75')
    ax_sil.legend(fontsize=8, loc='lower right')

    hist_line,  = ax_sil.plot([], [], color='steelblue', linewidth=1.5, zorder=2)
    hist_dots   = ax_sil.scatter([], [], color='steelblue', s=40, zorder=3)
    curr_dot    = ax_sil.scatter([], [], color='crimson', s=70, zorder=5)
    curr_text   = ax_sil.text(0, 0, '', fontsize=9, color='crimson',
                               ha='left', va='bottom')

    plt.tight_layout()

    # ── Frame update ──────────────────────────────────────────────────────────
    def update(frame_idx):
        frame = frames[frame_idx]
        centroids = frame['centroids']
        labels    = frame['labels']

        # Voronoi background
        grid_dists  = np.linalg.norm(
            grid_pts[:, None, :] - centroids[None, :, :], axis=2
        )
        grid_labels = np.argmin(grid_dists, axis=1).reshape(grid_res, grid_res)
        bg_img.set_data(grid_labels)

        # Point colors
        if frame['phase'] == 'init':
            colors = [UNASSIGNED_COLOR] * len(X)
        else:
            colors = [CLUSTER_COLORS[l] for l in labels]
        scatter.set_facecolors(colors)

        # Centroid markers
        for k in range(K):
            centroid_scatters[k].set_data([centroids[k, 0]], [centroids[k, 1]])

        # Caption
        caption.set_text(frame['description'])

        # Silhouette panel — reveal scores up to the current frame
        visible = [(it, s) for fi, it, s in history if fi <= frame_idx]
        if visible:
            its, scs = zip(*visible)
            hist_line.set_data(its, scs)
            hist_dots.set_offsets(np.c_[its, scs])
            cx, cy = its[-1], scs[-1]
            curr_dot.set_offsets([[cx, cy]])
            # nudge label so it doesn't overlap the dot
            label_x = cx + 0.08 if cx < max_iter - 0.5 else cx - 0.08
            curr_text.set_position((label_x, cy))
            curr_text.set_ha('left' if cx < max_iter - 0.5 else 'right')
            curr_text.set_text(f'{cy:.3f}')
        else:
            hist_line.set_data([], [])
            hist_dots.set_offsets(np.empty((0, 2)))
            curr_dot.set_offsets(np.empty((0, 2)))
            curr_text.set_text('')

        return ([bg_img, scatter, caption,
                 hist_line, hist_dots, curr_dot, curr_text]
                + centroid_scatters)

    anim = FuncAnimation(
        fig, update,
        frames=len(frames),
        interval=interval_ms,
        blit=False,
        repeat=True
    )

    plt.close(fig)
    return anim


anim = make_animation(X, frames, K=K, interval_ms=1000)
HTML(anim.to_jshtml())
---------------------------------------------------------------------------
ValueError                                Traceback (most recent call last)
Cell In[4], line 167
    163     return anim
    166 anim = make_animation(X, frames, K=K, interval_ms=1000)
--> 167 HTML(anim.to_jshtml())

File ~/.pyenv/versions/3.13.1/envs/datascience/lib/python3.13/site-packages/matplotlib/animation.py:1376, in Animation.to_jshtml(self, fps, embed_frames, default_mode)
   1372         path = Path(tmpdir, "temp.html")
   1373         writer = HTMLWriter(fps=fps,
   1374                             embed_frames=embed_frames,
   1375                             default_mode=default_mode)
-> 1376         self.save(str(path), writer=writer)
   1377         self._html_representation = path.read_text()
   1379 return self._html_representation

File ~/.pyenv/versions/3.13.1/envs/datascience/lib/python3.13/site-packages/matplotlib/animation.py:1109, in Animation.save(self, filename, writer, fps, dpi, codec, bitrate, extra_args, metadata, extra_anim, savefig_kwargs, progress_callback)
   1106     savefig_kwargs['transparent'] = False   # just to be safe!
   1108 for anim in all_anim:
-> 1109     anim._init_draw()  # Clear the initial frame
   1110 frame_number = 0
   1111 # TODO: Currently only FuncAnimation has a save_count
   1112 #       attribute. Can we generalize this to all Animations?

File ~/.pyenv/versions/3.13.1/envs/datascience/lib/python3.13/site-packages/matplotlib/animation.py:1770, in FuncAnimation._init_draw(self)
   1762         warnings.warn(
   1763             "Can not start iterating the frames for the initial draw. "
   1764             "This can be caused by passing in a 0 length sequence "
   (...)   1767             "it may be exhausted due to a previous display or save."
   1768         )
   1769         return
-> 1770     self._draw_frame(frame_data)
   1771 else:
   1772     self._drawn_artists = self._init_func()

File ~/.pyenv/versions/3.13.1/envs/datascience/lib/python3.13/site-packages/matplotlib/animation.py:1789, in FuncAnimation._draw_frame(self, framedata)
   1785     self._save_seq = self._save_seq[-self._save_count:]
   1787 # Call the func with framedata and args. If blitting is desired,
   1788 # func needs to return a sequence of any artists that were modified.
-> 1789 self._drawn_artists = self._func(framedata, *self._args)
   1791 if self._blit:
   1793     err = RuntimeError('The animation function must return a sequence '
   1794                        'of Artist objects.')

Cell In[4], line 112, in make_animation.<locals>.update(frame_idx)
    108 labels    = frame['labels']
    110 # Voronoi background
    111 grid_dists  = np.linalg.norm(
--> 112     grid_pts[:, None, :] - centroids[None, :, :], axis=2
    113 )
    114 grid_labels = np.argmin(grid_dists, axis=1).reshape(grid_res, grid_res)
    115 bg_img.set_data(grid_labels)

ValueError: operands could not be broadcast together with shapes (300,1,600) (1,3,2)
16.4. Try Different Initializations#
A key weakness of k-means is sensitivity to initialization — different starting centroids can lead to different (sometimes worse) final clusters. Run the cell below a few times with different seeds to see this in action.
import random

# Change this seed to see a different random initialization
SEED = random.randint(0, 999)
print(f"Using seed: {SEED}")

frames_alt = run_kmeans(X, K=K, rng=np.random.default_rng(SEED))
print(f"Converged in {frames_alt[-1]['iteration']} iteration(s), {len(frames_alt)} frames.")

anim_alt = make_animation(X, frames_alt, K=K, interval_ms=1000)
HTML(anim_alt.to_jshtml())
Using seed: 128
Converged in 15 iteration(s), 31 frames.
---------------------------------------------------------------------------
ValueError                                Traceback (most recent call last)
Cell In[5], line 11
      8 print(f"Converged in {frames_alt[-1]['iteration']} iteration(s), {len(frames_alt)} frames.")
     10 anim_alt = make_animation(X, frames_alt, K=K, interval_ms=1000)
---> 11 HTML(anim_alt.to_jshtml())

File ~/.pyenv/versions/3.13.1/envs/datascience/lib/python3.13/site-packages/matplotlib/animation.py:1376, in Animation.to_jshtml(self, fps, embed_frames, default_mode)
   1372         path = Path(tmpdir, "temp.html")
   1373         writer = HTMLWriter(fps=fps,
   1374                             embed_frames=embed_frames,
   1375                             default_mode=default_mode)
-> 1376         self.save(str(path), writer=writer)
   1377         self._html_representation = path.read_text()
   1379 return self._html_representation

File ~/.pyenv/versions/3.13.1/envs/datascience/lib/python3.13/site-packages/matplotlib/animation.py:1109, in Animation.save(self, filename, writer, fps, dpi, codec, bitrate, extra_args, metadata, extra_anim, savefig_kwargs, progress_callback)
   1106     savefig_kwargs['transparent'] = False   # just to be safe!
   1108 for anim in all_anim:
-> 1109     anim._init_draw()  # Clear the initial frame
   1110 frame_number = 0
   1111 # TODO: Currently only FuncAnimation has a save_count
   1112 #       attribute. Can we generalize this to all Animations?

File ~/.pyenv/versions/3.13.1/envs/datascience/lib/python3.13/site-packages/matplotlib/animation.py:1770, in FuncAnimation._init_draw(self)
   1762         warnings.warn(
   1763             "Can not start iterating the frames for the initial draw. "
   1764             "This can be caused by passing in a 0 length sequence "
   (...)   1767             "it may be exhausted due to a previous display or save."
   1768         )
   1769         return
-> 1770     self._draw_frame(frame_data)
   1771 else:
   1772     self._drawn_artists = self._init_func()

File ~/.pyenv/versions/3.13.1/envs/datascience/lib/python3.13/site-packages/matplotlib/animation.py:1789, in FuncAnimation._draw_frame(self, framedata)
   1785     self._save_seq = self._save_seq[-self._save_count:]
   1787 # Call the func with framedata and args. If blitting is desired,
   1788 # func needs to return a sequence of any artists that were modified.
-> 1789 self._drawn_artists = self._func(framedata, *self._args)
   1791 if self._blit:
   1793     err = RuntimeError('The animation function must return a sequence '
   1794                        'of Artist objects.')

Cell In[4], line 112, in make_animation.<locals>.update(frame_idx)
    108 labels    = frame['labels']
    110 # Voronoi background
    111 grid_dists  = np.linalg.norm(
--> 112     grid_pts[:, None, :] - centroids[None, :, :], axis=2
    113 )
    114 grid_labels = np.argmin(grid_dists, axis=1).reshape(grid_res, grid_res)
    115 bg_img.set_data(grid_labels)

ValueError: operands could not be broadcast together with shapes (300,1,600) (1,3,2)