
PS00 (Solutions by Prof Roth)#
Prof Eatai Roth
DS325 F2025
Gettysburg College
Before downloading this Problem Set file#
Let’s set up a Git repository folder on your local computer. This folder will hold all of your assignments and projects for this class and will be linked to a repository that lives on Github.
Jupyter notebook review#
Notebooks comprise two kinds of cells:
Markdown - text annotation (like this cell).
Code - cells that will run code.
Some useful keyboard shortcuts:
SHIFT+RETURN (SHIFT+ENTER on PC) - runs a cell and moves focus to the next cell
Esc -> A - adds a cell above the current cell (-> means followed by)
Esc -> B - adds a cell below the current cell
Esc -> M - converts a cell to Markdown
Esc -> Y - converts a cell to Code
Kernels#
When you first run a cell of code, VS Code will prompt you to select a kernel. You can think of a kernel as a computational session and VS Code wants to know which version of Python you’d like to use to execute your code. It will present a list of installed Python distributions; you should select the one that has ‘Anaconda’ in the path.
The kernel also keeps track of all the variables you’ve created in the session. If you want to run your code from a clean slate, you can restart the kernel to clear all variables.
Assignment grading#
I’ll be using a package called Otter Grader to help automate the grading and feedback you get on assignments. We’ll see how Otter grader works below, but first, we must install the package.
%%capture
!pip install otter-grader
import otter
grader = otter.Notebook()
Practice Problems#
Problem 1
Write a function named hello_blank that takes as an input any string and returns a new string ‘Hello [input string]!’
def hello_blank(word):
    return f'Hello {word}!'
# grader.check("q1")
Problem 2
Create a DataFrame mirroring the table below and assign this to icecream_df. Then group by the flavor column and find the mean price-per-scoop for each flavor; assign this series to price_by_flavor.
flavor |
scoops |
price |
|---|---|---|
chocolate |
1 |
2 |
vanilla |
1 |
1.5 |
chocolate |
2 |
3 |
strawberry |
1 |
2 |
strawberry |
3 |
4 |
vanilla |
2 |
2 |
mint |
1 |
4 |
mint |
2 |
5 |
chocolate |
3 |
5 |
import pandas as pd
import matplotlib.pyplot as plt
import numpy as np

icecream_df = pd.DataFrame(dict(
    flavor = ['chocolate', 'vanilla', 'chocolate',  'strawberry', 'strawberry', 'vanilla', 'mint', 'mint', 'chocolate'],
    scoops = [1, 1, 2, 1, 3, 2, 1, 2, 3],
    price = [2, 1.5, 3, 2, 4, 2, 4, 5, 5]
    )
    )
flavors_df = icecream_df.groupby('flavor').sum()
price_by_flavor =flavors_df['price']/flavors_df['scoops']
price_by_flavor
flavor
chocolate     1.666667
mint          3.000000
strawberry    1.500000
vanilla       1.166667
dtype: float64
# grader.check("q2a")
2b
Create a barplot of price_by_flavor.
plt.bar(x = price_by_flavor.index, height = price_by_flavor)
plt.ylabel('Price per scoop ($)')
plt.title('Price per scoop by flavor')
plt.show()
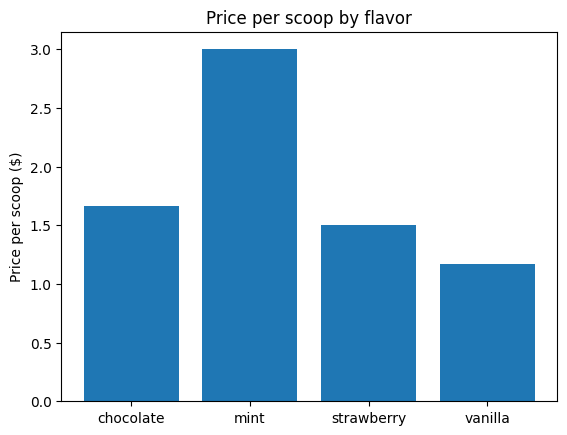
2c Per scoop, which flavor is most expensive?
Mint is most expensive.