ps04 - Group data storytelling#
Replace the above with your title
Due Nov 10, 12p (noon). FIRM DEADLINE.
YOUR NAME
collaborator 1
collaborator 2
collaborator 3
These data stories will be shared with the class, posted on the course website (just for this semester).
Thesis#
In a paragraph or so, explain the data story you want to tell.
What is the question you want to answer, the action you want to motivate, or the trend you want to highlight?
What is the take-home message you want the reader to leave with.
Analysis#
First, describe how you plan to make your argument.
What kind of model or analysis will you use (you do not have to detail the steps of the analysis here).
Justify your feature set and modeling approach.
How are you assessing your model? What aspect of your model or analysis supports your point? It could be an assessment of your model, a ranking of feature importances, the slope of the best-fit line, etc.
Below, write your analysis code. You may want to intersperse some explanatory text. Think of this notebook as an article or blog post.
You may use co-pilot to assist your coding and data visualization, but I expect well justified analyses.
'''Your analysis goes here'''
'Your analysis goes here'
Results and Discussion#
In this section, present your final visualization(s). These should be graphics that could be presented on a blog post or submitted to r/DataIsBeautiful.
Consider what is the best way to depict the data? What would be clear and convincing?
Intersperse your interpretation of the data in markdown cells (captions to your figures).
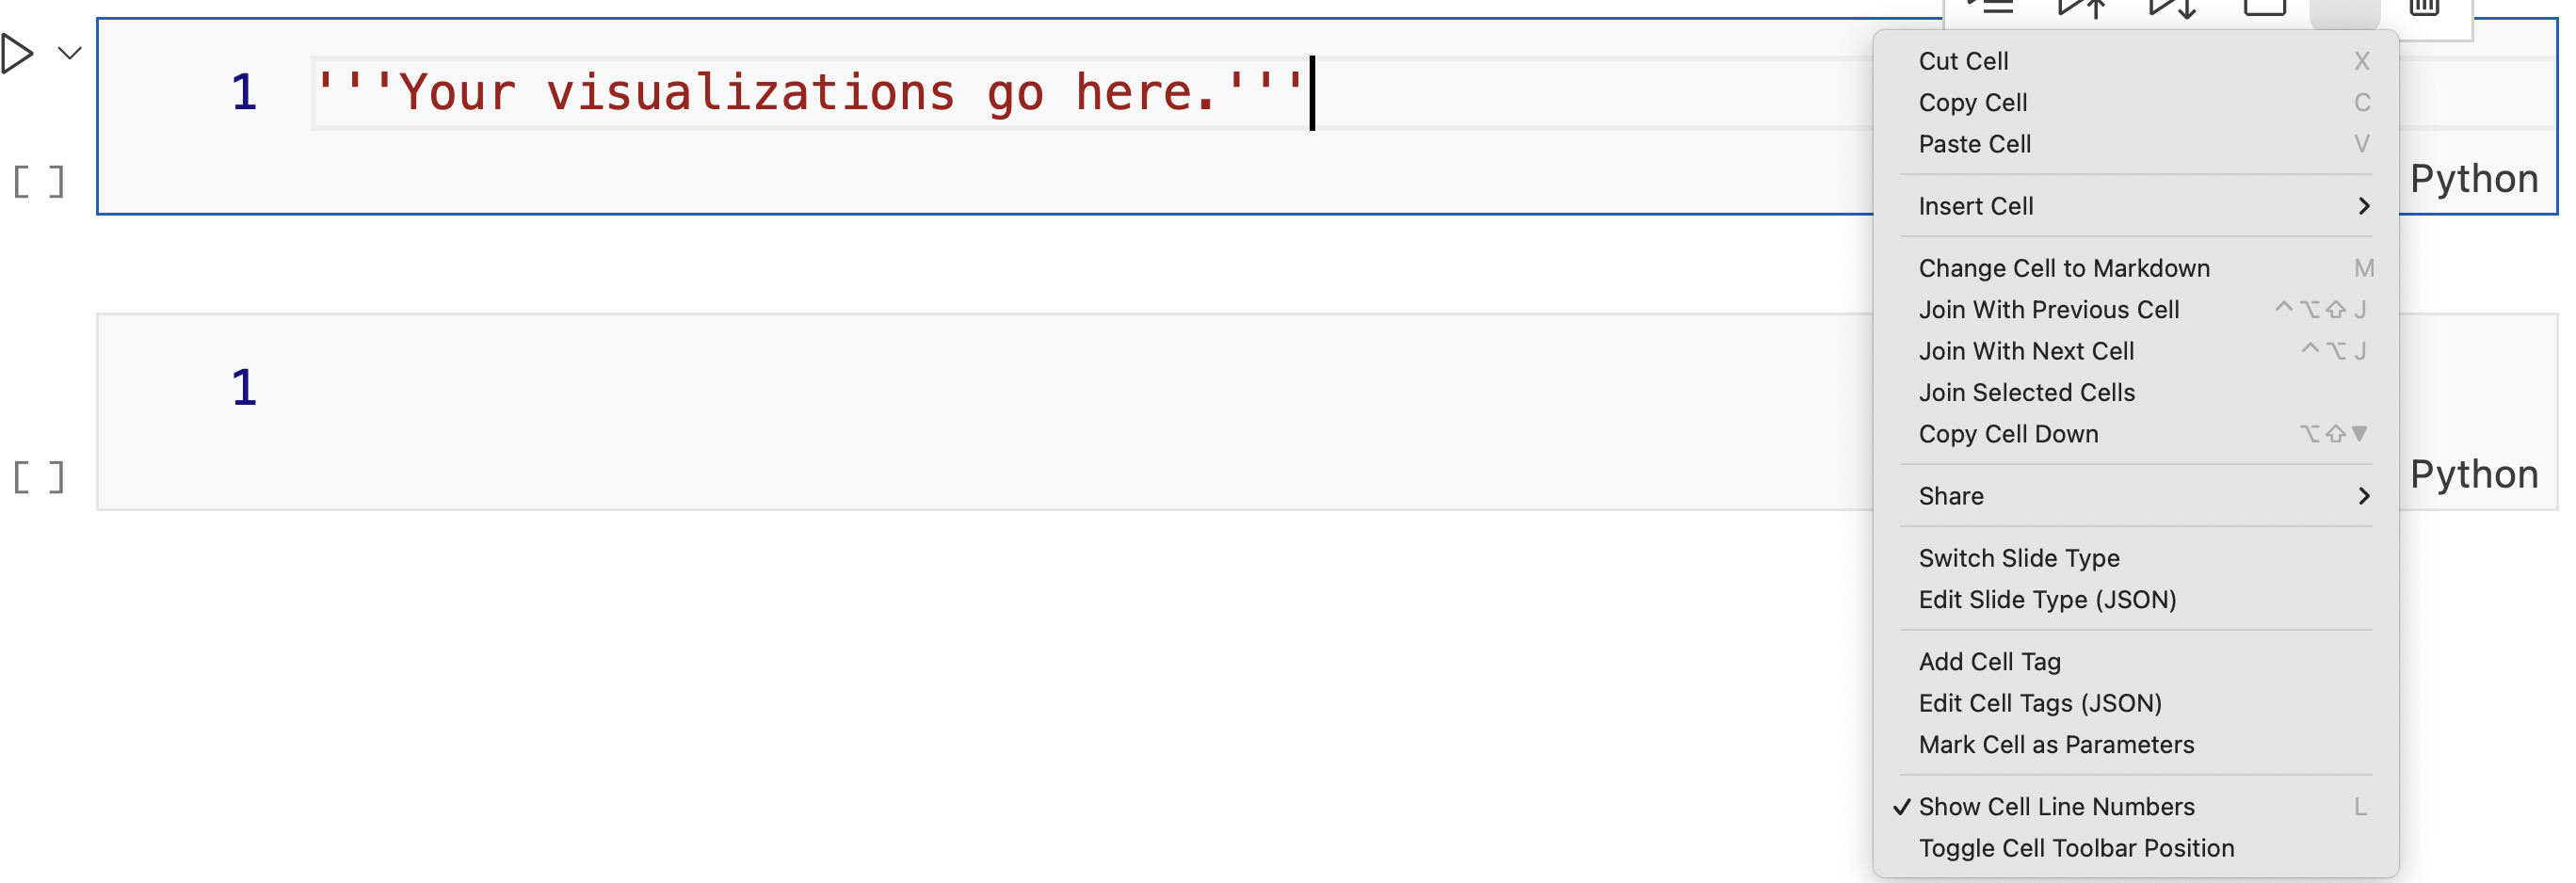
You may want to ‘hide’ some code for when the notebook is shared with the class. You can do this using cell tags. Select ‘Add Cell Tag’ from the cell dropdown menu and add the tag ‘hide-input’. This will hide the code but preserve the output. Below is an example.