
1. What is a model?#
“All models are wrong…but some models are useful.” – George Box (maybe)
What are some types of models you’ve ? (let’s aim for a diverse list)
Role model
Linear regression model
classification model
arma model (time-series model)
logistic regression model
super model
model organism
clustering model
large language model
template
lego model
architectural model
model train
Okay, then what is a model?
input, output
framework to follow
function
mold
simplifications/abstractions of real phenomena
How are models useful? What are their limitations?
import pandas as pd
import matplotlib.pyplot as plt
sp500 = pd.read_csv('https://raw.githubusercontent.com/GettysburgDataScience/datasets/refs/heads/main/sp500_1950_2025_weekly.csv',
                    parse_dates = ['Date'], thousands = ',')
sp500.head()
| Date | Price | Open | High | Low | Vol. | Change % | |
|---|---|---|---|---|---|---|---|
| 0 | 2025-08-31 | 6437.47 | 6386.45 | 6445.17 | 6360.53 | NaN | -0.35% |
| 1 | 2025-08-24 | 6460.26 | 6457.67 | 6508.23 | 6429.21 | NaN | -0.10% |
| 2 | 2025-08-17 | 6466.91 | 6445.02 | 6478.89 | 6343.86 | NaN | 0.27% |
| 3 | 2025-08-10 | 6449.80 | 6389.67 | 6481.34 | 6364.06 | NaN | 0.94% |
| 4 | 2025-08-03 | 6389.45 | 6271.71 | 6395.16 | 6271.71 | NaN | 2.43% |
murders_df = pd.read_csv('https://raw.githubusercontent.com/GettysburgDataScience/datasets/refs/heads/main/cdc_murdermortality_2023.csv',
                         thousands = ',')
murders_df.describe()
| YEAR | RATE | DEATHS | |
|---|---|---|---|
| count | 502.000000 | 477.000000 | 502.000000 |
| mean | 2018.515936 | 6.598323 | 413.547809 |
| std | 2.880651 | 3.969087 | 458.695970 |
| min | 2014.000000 | 0.000000 | 10.000000 |
| 25% | 2016.000000 | 3.600000 | 72.250000 |
| 50% | 2019.000000 | 6.100000 | 262.000000 |
| 75% | 2021.000000 | 8.500000 | 603.500000 |
| max | 2023.000000 | 33.100000 | 2495.000000 |
murders_df['POP'] = murders_df['DEATHS']/murders_df['RATE']
murders_df.head()
| YEAR | STATE | RATE | DEATHS | URL | POP | |
|---|---|---|---|---|---|---|
| 0 | 2023 | AL | 14.8 | 717 | /nchs/state-stats/states/al.html | 48.445946 |
| 1 | 2023 | AK | 8.5 | 61 | /nchs/state-stats/states/ak.html | 7.176471 |
| 2 | 2023 | AZ | 7.5 | 531 | /nchs/state-stats/states/az.html | 70.800000 |
| 3 | 2023 | AR | 11.3 | 325 | /nchs/state-stats/states/ar.html | 28.761062 |
| 4 | 2023 | CA | 5.1 | 1972 | /nchs/state-stats/states/ca.html | 386.666667 |
hw_df = pd.read_csv('https://raw.githubusercontent.com/GettysburgDataScience/datasets/refs/heads/main/SOCR-HeightWeight.csv',
                    index_col = 0)
hw_df.head()
| Height(Inches) | Weight(Pounds) | |
|---|---|---|
| Index | ||
| 1 | 65.78331 | 112.9925 |
| 2 | 71.51521 | 136.4873 |
| 3 | 69.39874 | 153.0269 |
| 4 | 68.21660 | 142.3354 |
| 5 | 67.78781 | 144.2971 |
fig, ax = plt.subplots(1, 3, figsize = (20, 5))

# Height vs Weight
ax[0].scatter(hw_df['Height(Inches)'], hw_df['Weight(Pounds)'], s = 1, alpha = 0.2)
ax[0].set_title('US Height vs Weight')
ax[0].set_xlabel('Height (in)')
ax[0].set_ylabel('Weight (lbs)')

# Homocides
murders2023_df = murders_df.query('YEAR==2023')
ax[1].scatter(murders2023_df['POP'], murders2023_df['DEATHS'], s = 10)

for i, row in murders2023_df.iterrows():
    ax[1].annotate(row['STATE'], (row['POP'], row['DEATHS']), fontsize=8, alpha = 0.5)

ax[1].set_title('2023 Homocides by population for US states')
ax[1].set_xlabel('Population (100K residents)')
ax[1].set_ylabel('Homocides')

# S&P 500
ax[2].plot(sp500['Date'], sp500['Price'])

ax[2].set_title('S&P500 over time')
ax[2].set_ylabel('Price at end of week ($)')
ax[2].set_xlabel('Date')

plt.show()
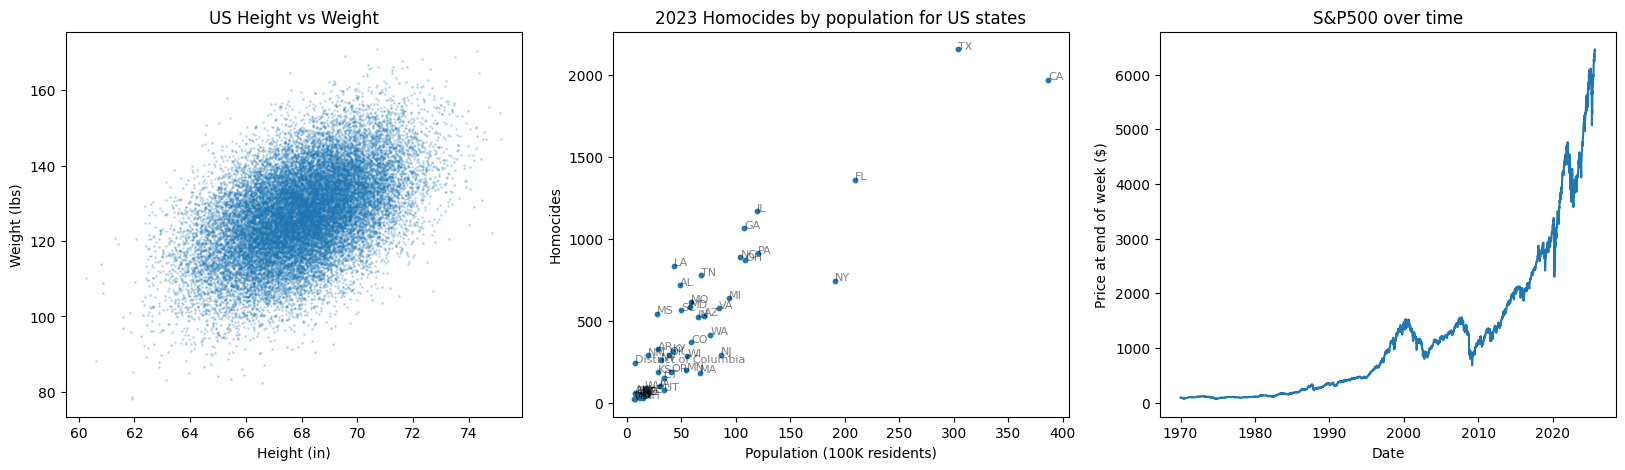
Answer the following questions based on the plots above.
US Height vs Weight
Given a room of 1000 Americans, what do you think the average height and weight would be?
Suppose a 6’ American (72 in), how much would you predict them to weigh?
What information might change your answers above?
US Homocides
Which states have a number of homocides above expectation?
If there were a new state with 30M residents, how many homocides would you expect?
S&P 500
When has the economy experienced there significant bubbles or recessions?
What do you expect the SP500 price to be in 2030?
How did you arrive at your answers for these questions?